PythiaPlotter


What Is It
Plots diagrams of particle decay trees from HEP Monte Carlo (MC) events. Very handy to figure out what is actually going on in your MC!
Click here for an interactive example.
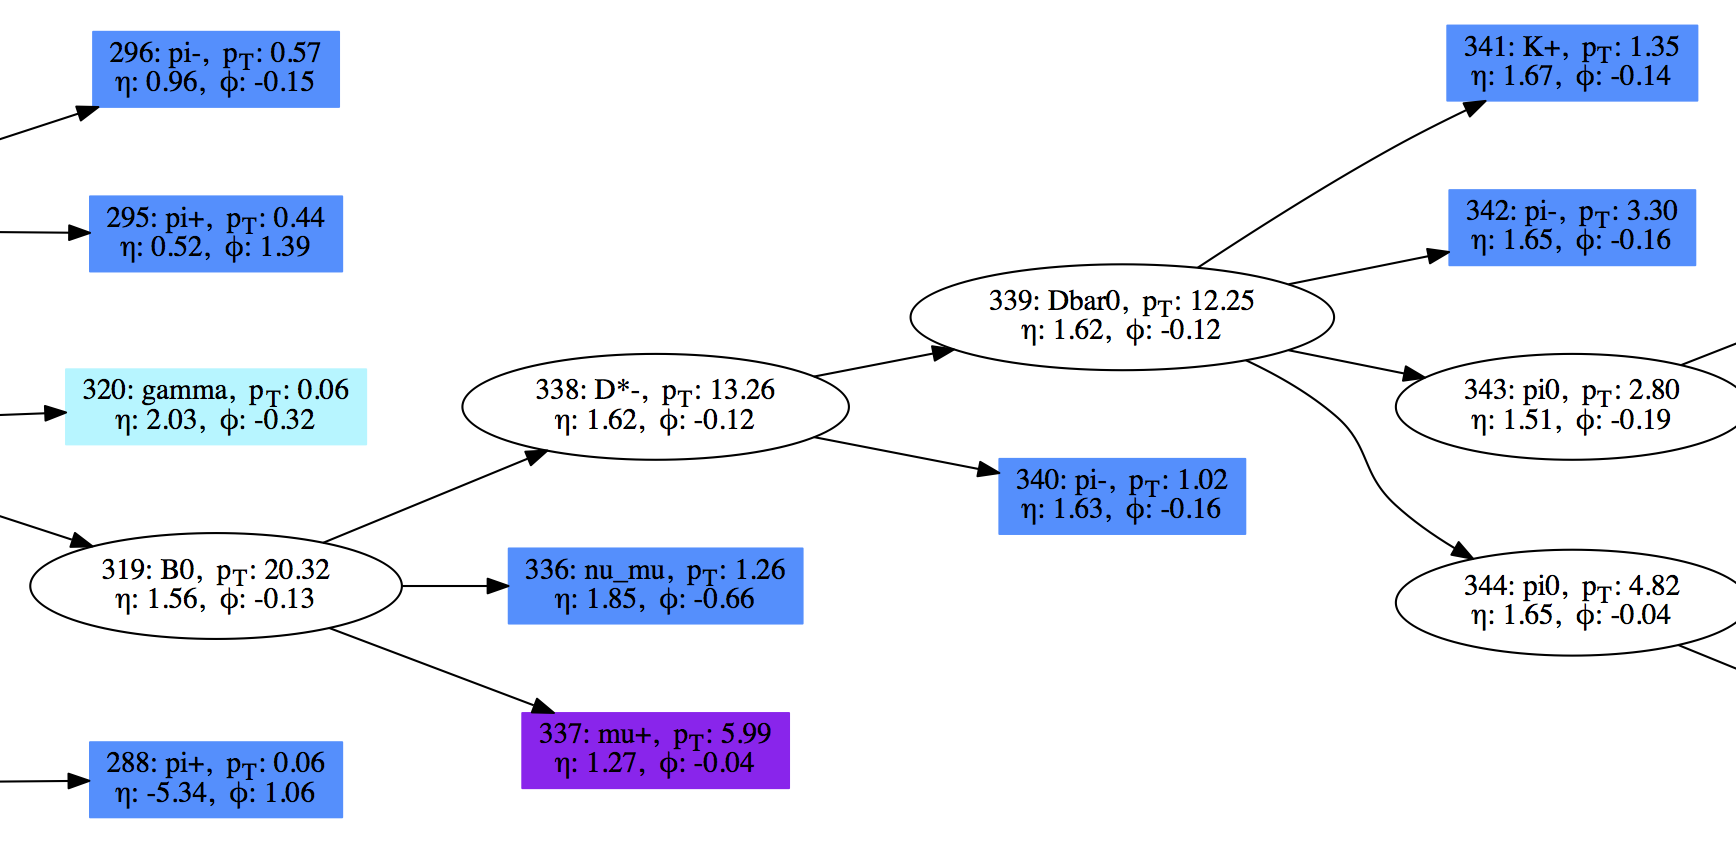
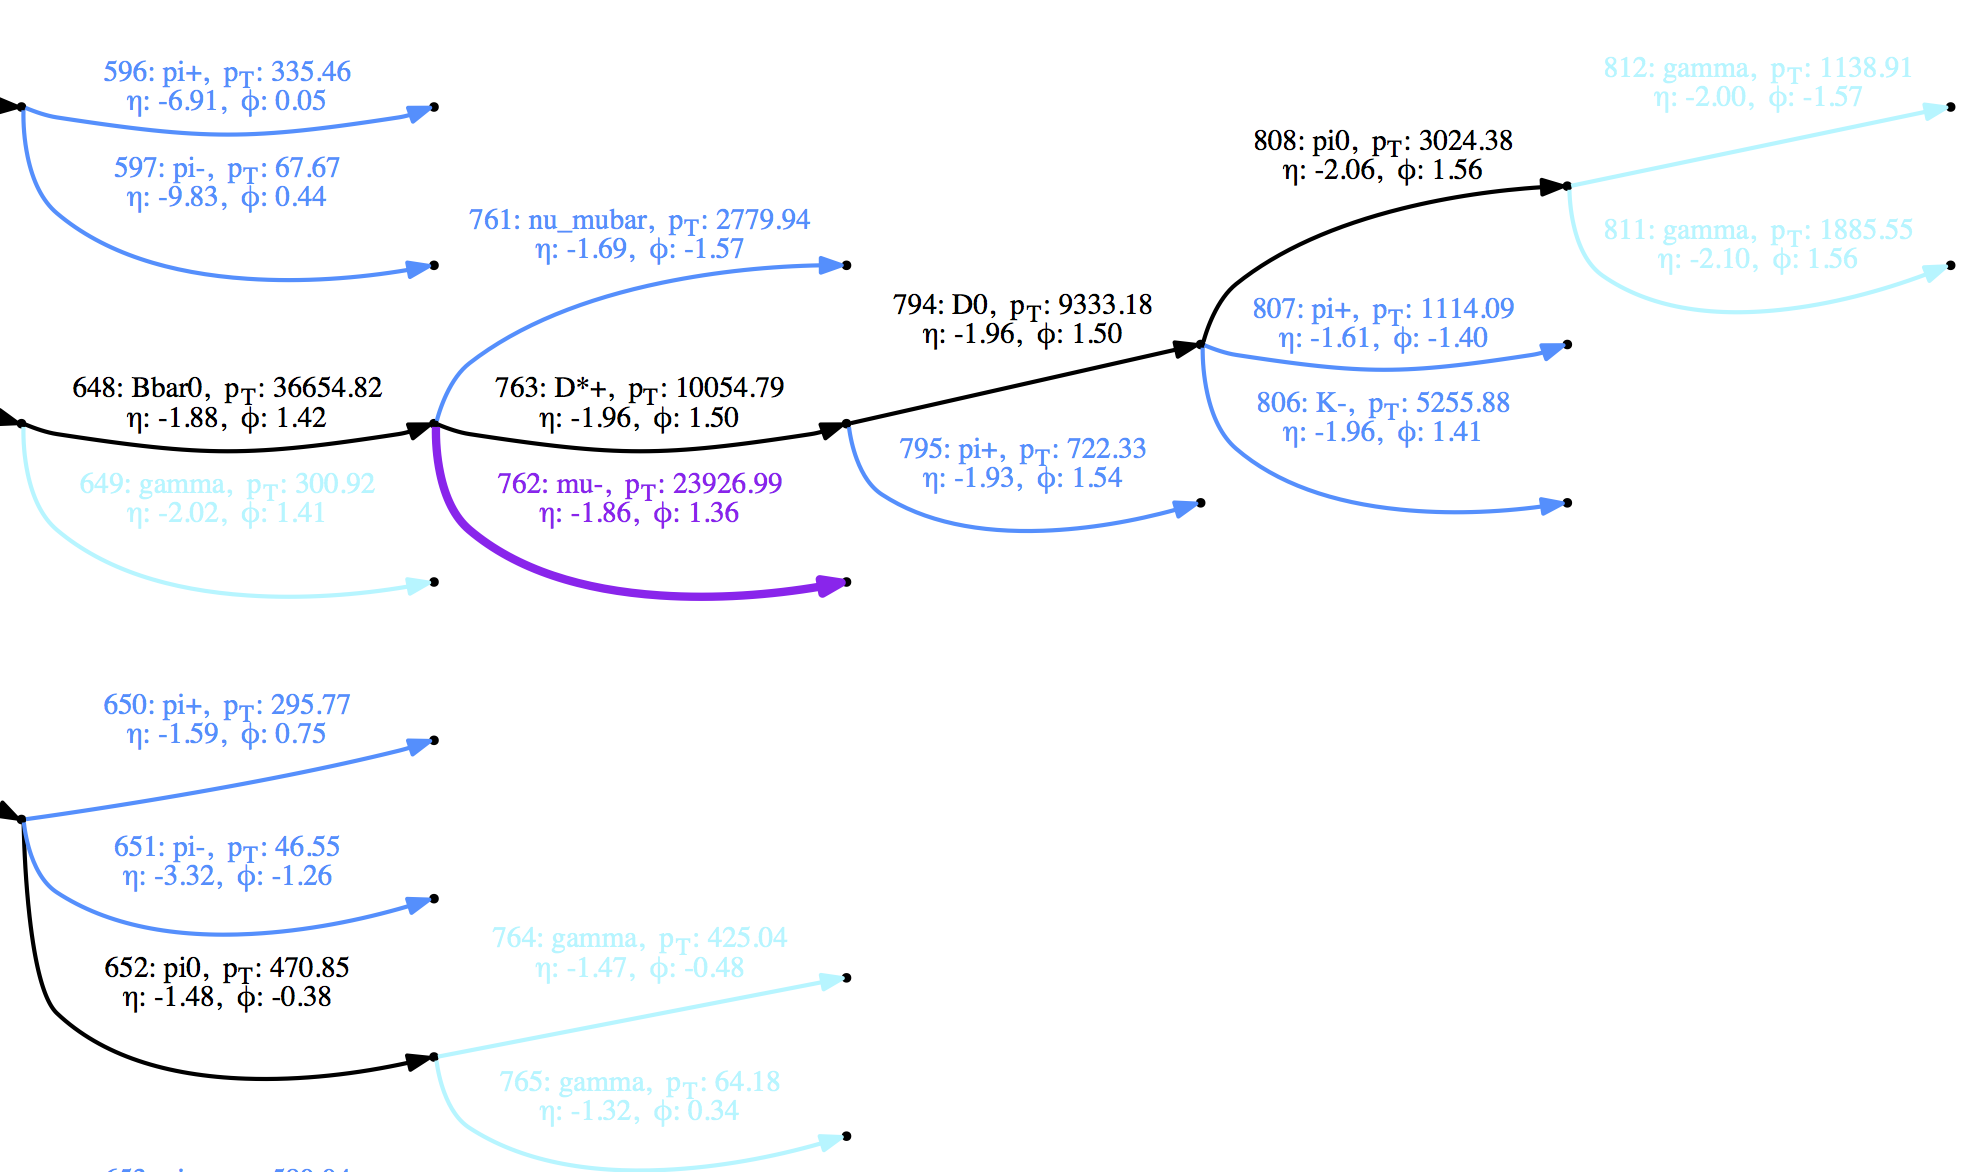
And some snippets from the PDF examples in the example folder:
What Can I Give It To Plot?
PythiaPlotter currently supports:
- Pythia 8 STDOUT (i.e. the big particle event table) (e.g. example/example_pythia8.txt)
- HepMC files (e.g. example/example_hepmc.hepmc)
- LHE files (e.g. example/example_lhe.lhe)
- ParticleListDrawer STDOUT as output by CMSSW (e.g. example/example_cmssw.txt)
- Heppy ROOT files - requires a special module to add mother/daughter relationships (e.g. example/example_heppy.root)
What Do I Need:
- Currently, both python 2.7 and python >=3.4 are supported (although the Heppy input is only supported by python 2.7 due to ROOT limitations)
- graphviz (If the command
which dotreturns a filepath, you will be fine) - PyROOT if you want to parse Heppy ROOT
NTuples. Note that if you are in a virtualenv, you will need to
enable global site packages. If ROOT cannot be found, then the
--inputFormat HEPPYoption will be disabled. - All other required python packages will be installed automatically
How Do I Get It:
- The easiest way is to use
pip:
pip install git+https://github.com/raggleton/PythiaPlotter.git
- It can also be cloned from Github and installed locally from the base directory:
make install
- If you really can’t install it, it is also possible to clone and run it in the main PythiaPlotter directory by doing:
python -m pythiaplotter
However this is the least recommended way, as you must be in the specific PythiaPlotter directory.
How Do I Use It:
Example usage (requires downloading the example input files in the example directory)
PythiaPlotter example/example_pythia8.txt --open --inputFormat PYTHIA --printer WEB
PythiaPlotter example/example_hepmc.hepmc --open --inputFormat HEPMC --printer DOT

# to show all options:
PythiaPlotter --help
There are various input (parser) and output (printer) options.
You should specify the input format using --inputFormat
(although it does try to guess), and and output printer using --printer
(defaults to DOT). There are also other options for specifying the
output filename and format.
MC generators often internally make several sequential copies of a
particle, updating it as the event evolves. For our purposes, these are
redundant particles that add no information, and just make things more
complicated. Therefore they are removed by default. To keep these
redundant particles use the --redundants flag.
Advanced: particle representations
Briefly, particles can be represented as nodes (graphically represented as a dot or blob) or edges (a line). In a generic graph, edges join together nodes, and may or may not have a direction. Here, we make use of the directionality of edges.
- Node representation: edges indicate a relationship between
particles, where the direction may be read as “produces” or “decays
into”. For example,
a ->- brepresentsadecaying intob. - Edge representation: edges represent particles, like in a Feynman diagram. Nodes therefore join connected particles, such that all incoming edges into a node may be seen a “producing” or “decaying into” all outgoing edges.
This difference is that input formats naturally fall into one of the two
representations. Pythia8, LHE, Heppy are all in the node
representation, whilst HepMC is in the edge representation. Included
in this program is the possibility to convert from the default
representation into the other representation using the
-r {NODE, EDGE} option. This can be useful to help elucidate what’s
going on in an event.
Note that redundant particle removal is done after representation conversion.
Full documentation:
See readthedocs